Lessons
What you'll learn
We start with simple concepts and build from there. You'll learn the fundamentals properly before we move ahead. That's what makes the rest stick.
- Spreadsheets from the very beginning: cells, rows, columns, saving and finding your file again
- Simple to complex math formulas
- The functions people actually use every day, like SUM, IF, VLOOKUP and XLOOKUP
- Formatting for professional presentations
- Sorting and filtering massive spreadsheets
- Using a spreadsheet as a database, so your records stay clean and findable
- Pivot tables, and how to use them in living spreadsheets
- Slicers, to reshape data for a different question in one click
- Graphs and charts that turn data into a readable slide
- Dashboards that put many numbers into one clear picture
- Data analysis: how to analyze a sheet of numbers and trust the answer you get
- Reports you can rebuild next month in a couple of minutes
- Macros, so the job you redo every week happens in one click
- The keyboard shortcuts and small habits that quietly make you fast
Beginner, intermediate or advanced
Wherever you are starting is lesson one. After the free call I put together a lesson plan for you, and we change it as you go, because what you need in week four is rarely what you thought you needed in week one.
You have never opened a spreadsheet
We start at the actual start: what a cell is, how to type in one, how to save the file and find it again tomorrow. Nothing is assumed and no question is too basic. Honestly, this is the group I most like teaching.
You get by, but you are guessing
You can total a column and sort a list, and everything past that feels like luck. We fill in the formulas and functions you are missing, then get you properly into pivot tables, charts and reports you trust.
You want the fast, powerful end
Dashboards, real data analysis — the part a job posting would call data analytics — lookups across several sheets, and macros to automate the work you repeat every week. Bring the file that is fighting you and we will take it apart together.
A pivot table, one piece at a time
Thousands of rows go in. One answer comes out. This is the single skill that changes how people see Excel, and it's usually learned in one sitting.
| A | B | C | D | |
|---|---|---|---|---|
| 3 | Sum of Revenue | Column Labels | ||
| 4 | Row Labels | Q1 | Q2 | Grand Total |
| 5 | Northeast | $17,138 | $19,402 | $36,540 |
| 6 | Midwest | $12,369 | $11,880 | $24,249 |
| 7 | South | $10,515 | $14,067 | $24,582 |
| 8 | West | $7,421 | $9,338 | $16,759 |
| 9 | Grand Total | $47,443 | $54,687 | $102,130 |
Slicers: ask a different question in one click
A slicer is a button that reshapes the whole report. Try one. This is exactly what it feels like in Excel.
Revenue by Rep
Click a region. The chart rebuilds itself, no formulas rewritten.
Graphs and charts: the same numbers, finally readable
Four ways to make the same kind of data readable. These are the charts we build together once the fundamentals are solid: the same figures a spreadsheet full of rows would give you, except you can take them in at a glance.
Sales by Product and Year
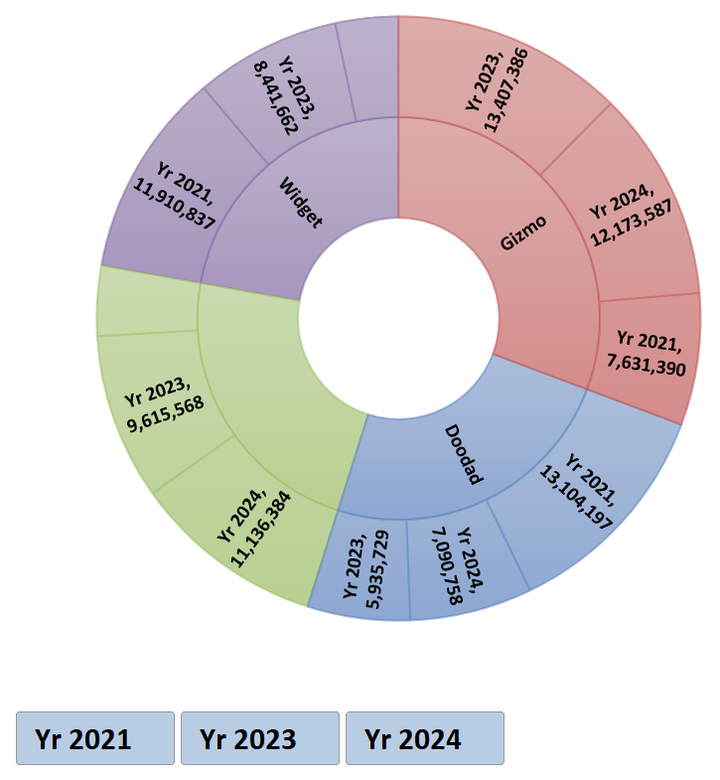
One ring for the product, one for the year, and slicer buttons to switch between them.
Sales Breakup % by Segment
Each tile's size is its share of sales. The big ones find themselves.
Units Sold % by State
- New Jersey
- New York
- Pennsylvania
- Connecticut
- Delaware
Where the units actually went, as a share of the whole.
Profit $ Generated by Month
A year of profit in one line, so the trend is the first thing you see.
Dashboards: everything that matters, on one screen
When the numbers live in one picture, you stop hunting through tabs and start making decisions.
Before and after: one question, one answer
This is the whole job in one picture. It's the same file on both sides, and the same numbers. The only thing that changed is that somebody knew how to ask it a question.
Before example
Eight thousand order rows, exactly the way they come out of the system.
You could scroll this all day and still not know how the year went.
After example
The same file, once we ask it which region sold the most last year?
One answer you can act on.